
Page 55 - Demo
P. 55
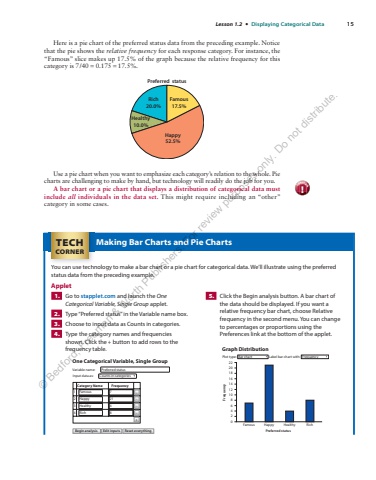
Lesson 1.2 %u2022 Displaying Categorical Data 15 Here is a pie chart of the preferred status data from the preceding example. Notice that the pie shows the relative frequency for each response category. For instance, the %u201cFamous%u201d slice makes up 17.5% of the graph because the relative frequency for this category is 7/40 0.175 17.5% = = . Preferred statusRich20.0%Famous17.5%Happy52.5%Healthy10.0% Use a pie chart when you want to emphasize each category%u2019s relation to the whole. Pie charts are challenging to make by hand, but technology will readily do the job for you. A bar chart or a pie chart that displays a distribution of categorical data must include all individuals in the data set. This might require including an %u201cother%u201d category in some cases. caution! Making Bar Charts and Pie Charts You can use technology to make a bar chart or a pie chart for categorical data. We%u2019ll illustrate using the preferred status data from the preceding example. Applet 1. Go to stapplet.com and launch the One Categorical Variable, Single Group applet. 2. Type %u201cPreferred status%u201d in the Variable name box. 3. Choose to input data as Counts in categories. 4. Type the category names and frequencies shown. Click the + button to add rows to the frequency table. One Categorical Variable, Single GroupCategory NameBegin analysis Edit inputs Reset everythingFrequencyVariable name:Input data as:12 HappyHealthyRich34Famous 72148 %u2013%u2013%u2013%u2013+Preferred statusCounts in categories 5. Click the Begin analysis button. A bar chart of the data should be displayed. If you want a relative frequency bar chart, choose Relative frequency in the second menu. You can change to percentages or proportions using the Preferences link at the bottom of the applet. 0 Famous Happy Healthy RichPreferred status246810121416182022Plot type: Bar chart Frequency FrequencyGraph DistributionLabel bar chart with:TECHCORNER %u00a9 Bedford, Freeman & Worth Publishers. For review purposes only. Do not distribute.
