
Page 57 - Demo
P. 57
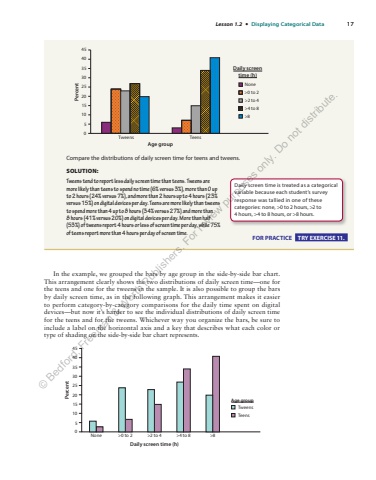
Lesson 1.2 %u2022 Displaying Categorical Data 17 In the example, we grouped the bars by age group in the side-by-side bar chart. This arrangement clearly shows the two distributions of daily screen time%u2014one for the teens and one for the tweens in the sample. It is also possible to group the bars by daily screen time, as in the following graph. This arrangement makes it easier to perform category-by-category comparisons for the daily time spent on digital devices%u2014but now it%u2019s harder to see the individual distributions of daily screen time for the teens and for the tweens. Whichever way you organize the bars, be sure to include a label on the horizontal axis and a key that describes what each color or type of shading on the side-by-side bar chart represents. Daily screen time (h)PercentNone >0 to 2 >2 to 4 >4 to 8 >8454035302520151050Age groupTweensTeensAge groupPercent454035302520151050Tweens TeensDaily screentime (h)None>0 to 2>2 to 4>4 to 8>8 Compare the distributions of daily screen time for teens and tweens. SOLUTION: Tweens tend to report less daily screen time than teens. Tweens are more likely than teens to spend no time (6% versus 3%), more than 0 up to 2 hours (24%%u00a0versus 7%), and more than 2 hours up to 4 hours (23% versus 15%) on digital devices per day. Teens are more likely than tweens to spend more than 4 up to 8 hours (34% versus 27%) and more than 8%u00a0hours (41% versus 20%) on digital devices per day. More than half (53%) of tweens report 4 hours or less of screen time per day, while 75% of teens report more than 4 hours per day of screen time. FOR PRACTICE TRY EXERCISE 11. Daily screen time is treated as a categorical variable because each student%u2019s survey response was tallied in one of these categories: none, >0 to 2 hours, >2 to 4%u00a0hours, >4 to 8 hours, or >8 hours. %u00a9 Bedford, Freeman & Worth Publishers. For review purposes only. Do not distribute.
