
Page 62 - Demo
P. 62
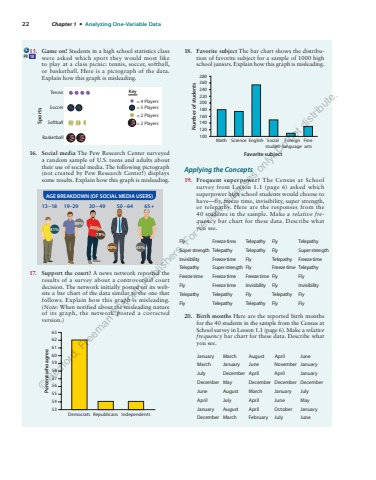
22 Chapter 1 %u2022 Analyzing One-Variable Data15. Game on! Students in a high school statistics class were asked which sport they would most like to play at a class picnic: tennis, soccer, softball, or basketball. Here is a pictograph of the data. Explain how this graph is misleading. TennisSoccerSoftballBasketballSports= 4 Players= 5 Players= 2 Players= 2 PlayersKey16. Social media The Pew Research Center surveyed a random sample of U.S. teens and adults about their use of social media. The following pictograph (not created by Pew Research Center!) displays some results. Explain how this graph is misleading. 13 %u201318 19%u201329 30 %u2013 49AGE BREAKDOWN (OF SOCIAL MEDIA USERS)50%u201364 65 +89%78%60% 43%81%17. Support the court? A news network reported the results of a survey about a controversial court decision. The network initially posted on its website a bar chart of the data similar to the one that follows. Explain how this graph is misleading. ( Note: When notified about the misleading nature of its graph, the network posted a corrected version.) 6362616059585756555453Percent who agreeDemocrats Republicans Independents18. Favorite subject The bar chart shows the distribution of favorite subject for a sample of 1000 high school juniors. Explain how this graph is misleading. 280260240220200180160 Number of students 140120100Math Science English SocialstudiesForeignlanguageFineartsFavorite subjectApplying the Concepts 19. Frequent superpower? The Census at School survey from Lesson 1.1 ( page 6 ) asked which superpower high school students would choose to have%u2014fly, freeze time, invisibility, super strength, or telepathy. Here are the responses from the 40 students in the sample. Make a relative frequency bar chart for these data. Describe what you see. 20. Birth months Here are the reported birth months for the 40 students in the sample from the Census at School survey in Lesson 1.1 ( page 6 ). Make a relative frequency bar chart for these data. Describe what you see. January March August April June March January June November January July December April April January December May December December December June August March January July April July April June May January August April October January December March February July June pg 18 Fly Freeze time Telepathy Fly Telepathy Super strength Telepathy Telepathy Fly Super strength Invisibility Freeze time Fly Telepathy Freeze time Telepathy Super strength Fly Freeze time Telepathy Freeze time Freeze time Freeze time Fly Fly Fly Freeze time Invisibility Fly Invisibility Telepathy Telepathy Fly Telepathy Fly Fly Telepathy Telepathy Fly Fly %u00a9 Bedford, Freeman & Worth Publishers. For review purposes only. Do not distribute.
