
Page 63 - Demo
P. 63
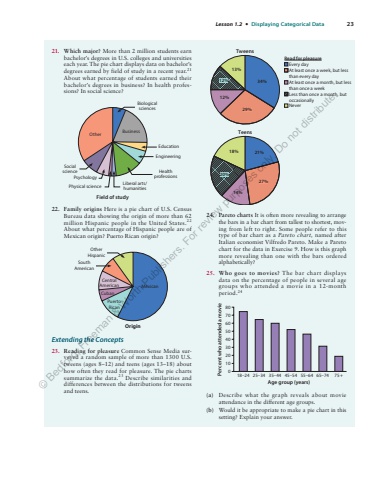
Lesson 1.2 %u2022 Displaying Categorical Data 2321. Which major? More than 2 million students earn bachelor%u2019s degrees in U.S. colleges and universities each year. The pie chart displays data on bachelor%u2019s degrees earned by field of study in a recent year.21About what percentage of students earned their bachelor%u2019s degrees in business? In health professions? In social science?Business OtherEducationHealthprofessionsSocialsciencePsychologyLiberal arts/humanitiesBiologicalsciencesField of studyPhysical scienceEngineering22. Family origins Here is a pie chart of U.S. Census Bureau data showing the origin of more than 62 million Hispanic people in the United States.22About what percentage of Hispanic people are of Mexican origin? Puerto Rican origin?OtherHispanicSouthAmericanCentralAmericanCubanPuertoRicanMexicanOriginExtending the Concepts23. Reading for pleasure Common Sense Media surveyed a random sample of more than 1300 U.S. tweens (ages 8%u201312) and teens (ages 13%u201318) about how often they read for pleasure. The pie charts summarize the data.23 Describe similarities and differences between the distributions for tweens and teens.24. Pareto charts It is often more revealing to arrange the bars in a bar chart from tallest to shortest, moving from left to right. Some people refer to this type of bar chart as a Pareto chart, named after Italian economist Vilfredo Pareto. Make a Pareto chart for the data in Exercise 9. How is this graph more revealing than one with the bars ordered alphabetically?25. Who goes to movies? The bar chart displays data on the percentage of people in several age groups who attended a movie in a 12-month period.2418%u201324 25%u201334 35%u201344 45%u201354 55%u201364 65%u201374 75+Age group (years)01020304050607080Percent who attended a movie(a) Describe what the graph reveals about movie attendance in the different age groups.(b) Would it be appropriate to make a pie chart in this setting? Explain your answer.18% 21%13%34%20%29%27%14%12%12%TweensTeensRead for pleasureEvery dayAt least once a week, but lessthan every dayAt least once a month, but lessthan once a weekLess than once a month, butoccasionallyNever%u00a9 Bedford, Freeman & Worth Publishers. For review purposes only. Do not distribute.
