
Page 67 - Demo
P. 67
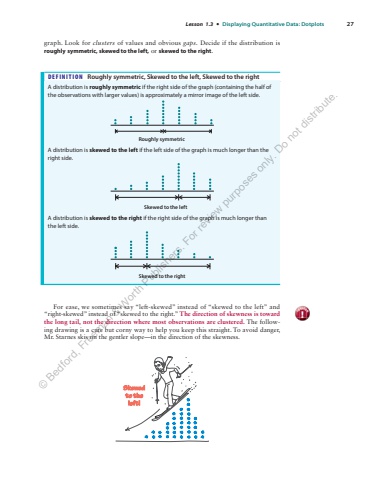
Lesson 1.3 %u2022 Displaying Quantitative Data: Dotplots 27graph. Look for clusters of values and obvious gaps. Decide if the distribution is roughly symmetric, skewed to the left, or skewed to the right. DEFINITION Roughly symmetric, Skewed to the left, Skewed to the right A distribution is roughly symmetric if the right side of the graph (containing the half of the observations with larger values) is approximately a mirror image of the left side. Roughly symmetric A distribution is skewed to the left if the left side of the graph is much longer than the right side. Skewed to the left A distribution is skewed to the right if the right side of the graph is much longer than the left side. Skewed to the right For ease, we sometimes say %u201cleft-skewed%u201d instead of %u201cskewed to the left%u201d and %u201cright-skewed%u201d instead of %u201cskewed to the right.%u201d The direction of skewness is toward the long tail, not the direction where most observations are clustered. The following drawing is a cute but corny way to help you keep this straight. To avoid danger, Mr. Starnes skis on the gentler slope%u2014in the direction of the skewness. Skewedto theleft!caution!%u00a9 Bedford, Freeman & Worth Publishers. For review purposes only. Do not distribute.
